 Plexara
Plexara Research · Technical Report
Ablating the platform and learning from empty: controlled measurements of a semantic MCP layer on agent data-question accuracy
Plexara, a product of Deasil Works · 2026-07-18, report v2.0.1 2026-08-01 · Model: claude-sonnet-5 · Data and code: txn2/mcp-data-platform · DOI: 10.5281/zenodo.21438044
Abstract
We measure whether an AI agent connected to a semantic data platform answers real data questions more correctly and efficiently than the same agent connected to bare data tools. Two complementary studies are reported. The first ablates the platform, not the model: every run holds the model, prompt scaffold, seed data, and task set constant and varies only the platform configuration across four arms. Over 261 graded attempts per arm at three repeats, the semantic layer lifts knowledge-trap accuracy from 42.7% to 98.7%, a +56.0-point gain (95% bootstrap CI +44 to +67), while reaching a correct answer in fewer tool calls (median 16 to 10) than bare tools reach a mostly-wrong one. Discovery and arithmetic tasks are near ceiling for every arm, localizing the platform’s effect to exactly the questions where a fact outside the raw data disambiguates a plausible-but-wrong answer. The companion cold-start experiment starts the platform from an empty knowledge layer, the fresh-install scenario, and teaches six business facts one at a time: trap accuracy climbs from a baseline that reproduces across five independent runs (mean 47.2%) to 90.7% at three repeats and 100% at one, with each taught fact jumping from floor to ceiling at its own promotion checkpoint. Every number carries a bootstrap confidence interval, derives from the platform’s own audit log, and regenerates from committed raw data with a single notebook run.
This page presents the results with commercial framing. Citing this research? Cite the brand-neutral report published in the open-source project, archived with its raw data on Zenodo under DOI 10.5281/zenodo.21438044. That is the concept DOI and always resolves to the latest version; to pin the exact snapshot these numbers came from, cite 10.5281/zenodo.21751635 (v2.0.1). The report’s final section gives the suggested citation and BibTeX.
1. Why measure the platform, not the model
Almost every AI-on-your-data failure looks the same in production: the query runs, the arithmetic is fine, and the answer is confidently, professionally wrong. The missing piece is rarely a tool. It is a fact about the data the tools touch: amounts stored in cents, revenue defined net of discounts, a fiscal year that starts in February, a table that was deprecated eighteen months ago and still looks authoritative. Semantic enrichment, the automatic attachment of that context to every tool result, is the core capability Plexara is built around, and it works alongside the rest of the platform: the API gateway that turns OpenAPI services into semantically discoverable tools, and the memory-to-knowledge lifecycle that captures what agents learn and promotes it into durable, shared context. Plexara runs in production for real clients, answering real questions every day, and that field record told us the approach works. Field experience does not tell you by how much, on which questions, or where to aim the next round of improvement. Benchmarks are how we turn thousands of production successes into controlled, repeatable evidence.
So we built a benchmark whose single design commitment is that the model is never the variable. Every run uses the same model, the same prompt scaffold, the same seed data, and the same tasks; only the platform configuration changes. Any difference in the answers is therefore attributable to the platform and nothing else. This inverts the usual agent benchmark, which compares models against a fixed set of tools; here the tools ablation is the experiment. The effect concentrates exactly where the BIRD text-to-SQL benchmark measured a roughly 20-point external knowledge gap using hand-curated evidence, except the platform retrieves that evidence automatically rather than having a human paste it in. A companion cold-start experiment then asks the harder longitudinal question: starting from a completely empty knowledge layer, does the platform visibly learn as facts are taught to it, the way a fresh installation learns on the job?
2. Method
The four arms are platform configuration profiles, not code forks. Each turns on exactly one more layer, so the ladder isolates where value enters.
- A0 raw toolsThe underlying data tools directly (trino_*, s3_*): no semantic provider, no search, all cross-enrichment off. Equivalent to wiring the standalone toolkit libraries.
- A1 enrichmentA0 plus semantic cross-enrichment: tool results carry DataHub context automatically, but the agent still has no search and no datahub_* tools. Isolates enrichment from discovery.
- A2 platformThe shipped semantic-first platform: A1 plus the search tool, the search-first gate, and curated knowledge pages.
- A3 lifecycleA2 plus the memory and apply_knowledge lifecycle. On single-session S1 to S3 tasks it tracks A2; the lifecycle effect is what the S5 protocols measure.
Three suites test different things. S1 discovery is straightforward lookups; S2 analytical accuracy is exact numeric answers, four of which emit SQL graded by executing both the candidate and a reference query and comparing result sets; S3 knowledge traps are questions with a plausible-but-wrong answer whose disambiguating fact lives in business knowledge, not the raw data.
Grading is deterministic, scoring only the first line after a mandated FINAL ANSWER marker. The platform’s own audit log is the measurement instrument: the harness mints a session handle, threads it invisibly, and reads efficiency metrics back from the admin audit API, failing loudly when a session’s audit rows fall outside its client-side accounting. Attempts that fail at the harness level never grade and are reported separately. Ground truth is generated from one fixed-seed dataset model and computed from the generated rows, never hand-typed. Accuracy is the per-attempt average across k = 3 repeats with a 95% percentile bootstrap CI; pass^3 is the stricter all-or-nothing bar of passing every one of the three attempts, following tau-bench.
The ablation ran on the Anthropic API adapter; the cold-start study ran through the Claude Code client. The two client paths shift accuracy in ways that have nothing to do with the platform (the client inserts its own system prompt and retry policy), so the harness records the client version and refuses to fold them into one leaderboard. The two studies are reported separately and no cross-path accuracy comparison is drawn.
3. Results: the surfacing effect (S1 to S3)
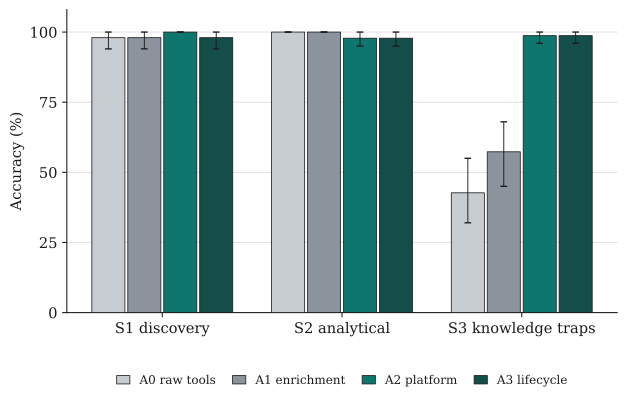
Discovery and arithmetic are near ceiling for every arm: a capable model finds tables and computes sums without help. The entire separation is in S3, where the answer depends on a fact outside the data. Knowledge-trap accuracy climbs 42.7% to 57.3% to 98.7% as the two surfacing channels come online, a +56.0-point gain for the full platform over bare tools.
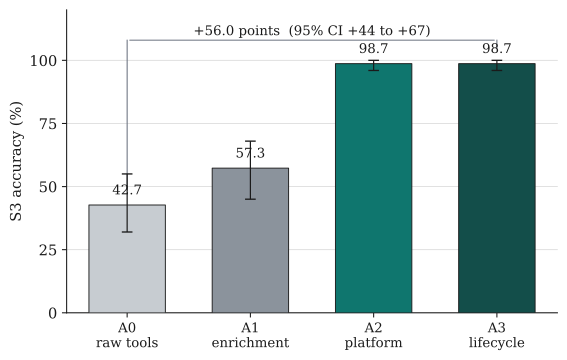
| Suite | A0 | A1 | A2 | A3 |
|---|---|---|---|---|
| S1 discovery | 98.0 [94–100] | 98.0 [94–100] | 100.0 [100–100] | 98.0 [94–100] |
| S2 analytical accuracy | 100.0 [100–100] | 100.0 [100–100] | 97.8 [95–100] | 97.8 [95–100] |
| S3 knowledge traps | 42.7 [32–55] | 57.3 [45–68] | 98.7 [96–100] | 98.7 [96–100] |
| Overall | 83.1 [79–88] | 87.4 [83–91] | 98.5 [97–100] | 98.1 [96–100] |
The trap-class breakdown shows the mechanism, and it is legible. The two surfacing channels carry different facts. Units-in-cents and net-revenue live in DataHub column and dataset descriptions, so the cross-enrichment channel alone (A1) lifts them materially (62 to 88, 13 to 43). Fiscal-calendar and tier-boundary live only in knowledge pages, invisible to enrichment, so A0 and A1 score 0% and only the search channel (A2) recovers them. Each trap is defeated exactly when the channel that carries its fact is switched on.
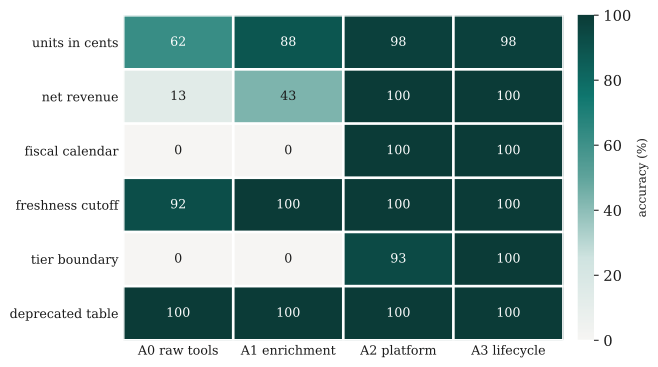
| Trap class | Fact lives in | A0 | A1 | A2 | A3 |
|---|---|---|---|---|---|
| Units in cents | column / dataset description | 62 | 88 | 98 | 98 |
| Net revenue | column / dataset description | 13 | 43 | 100 | 100 |
| Fiscal calendar | knowledge page only | 0 | 0 | 100 | 100 |
| Freshness cutoff | description + page | 92 | 100 | 100 | 100 |
| Tier boundary | knowledge page only | 0 | 0 | 93 | 100 |
| Deprecated table | metadata + page | 100 | 100 | 100 | 100 |
Efficiency moves the same direction. On the knowledge traps the platform reaches a correct answer in fewer calls (median 16 to 10) than bare tools reach a mostly-wrong one: without the disambiguating fact the model flails, issuing exploratory queries and reasoning in circles. On the easy suites the platform pays a small friction cost as the model adopts the search-first workflow, consistent with its value concentrating where knowledge decides the answer.
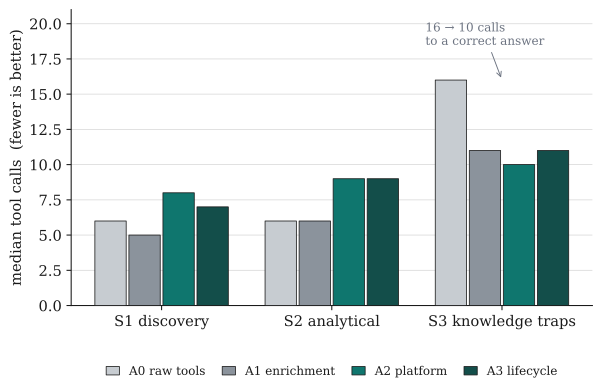
| Suite | A0 | A1 | A2 | A3 |
|---|---|---|---|---|
| S1 discovery | 6 | 5 | 8 | 7 |
| S2 analytical accuracy | 6 | 6 | 9 | 9 |
| S3 knowledge traps | 16 | 11 | 10 | 11 |
4. Results: learning from empty (cold start)
The ablation seeds the knowledge layer up front and asks whether the platform delivers what it holds. The cold-start study asks the harder question a new deployment actually faces: starting from a completely empty knowledge layer (entities present, but no descriptions, tags, glossary, or knowledge pages), does the platform get measurably smarter as it is taught? Six business facts are taught one at a time through ordinary agent sessions; each captured insight is promoted to a durable sink, a DataHub description or a knowledge page, and after every promotion the full 25-task trap suite is re-run by a fresh evaluator identity that was never taught anything. Any knowledge reaching the evaluator had to travel through the platform itself.
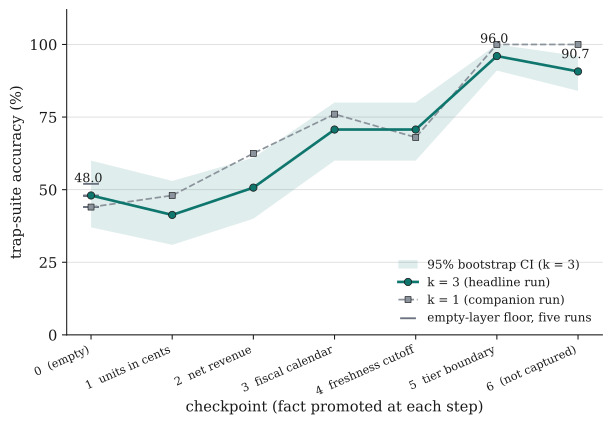
| Checkpoint | Fact promoted | k = 3 accuracy | k = 1 accuracy |
|---|---|---|---|
| 0 | none (empty baseline) | 48.0 [37–60] | 44.0 |
| 1 | Units in cents (DataHub) | 41.3 [31–53] | 48.0 |
| 2 | Net revenue (knowledge page) | 50.7 [40–61] | 62.5 |
| 3 | Fiscal calendar (knowledge page) | 70.7 [60–80] | 76.0 |
| 4 | Freshness cutoff (DataHub) | 70.7 [60–80] | 68.0 |
| 5 | Tier boundary (knowledge page) | 96.0 [91–100] | 100.0 |
| 6 | Deprecated table (never captured) | 90.7 [84–96] | 100.0 |
The aggregate curve climbs from a five-run baseline floor averaging 47.2% to 90.7% at k = 3, and the k = 1 companion run reaches 100%. But the aggregate is not where the evidence is strongest. The per-class trajectories are: each taught fact jumps from its floor to its ceiling at or immediately after its own promotion checkpoint. The fiscal-calendar questions sit at 0% for three straight checkpoints, then hit 86.7% the moment that fact is promoted. The tier-boundary questions sit at 0% for five checkpoints, then hit 100% at their own promotion. The platform does not drift upward; it learns each specific fact when taught, which is the causal signature a learning curve should have.
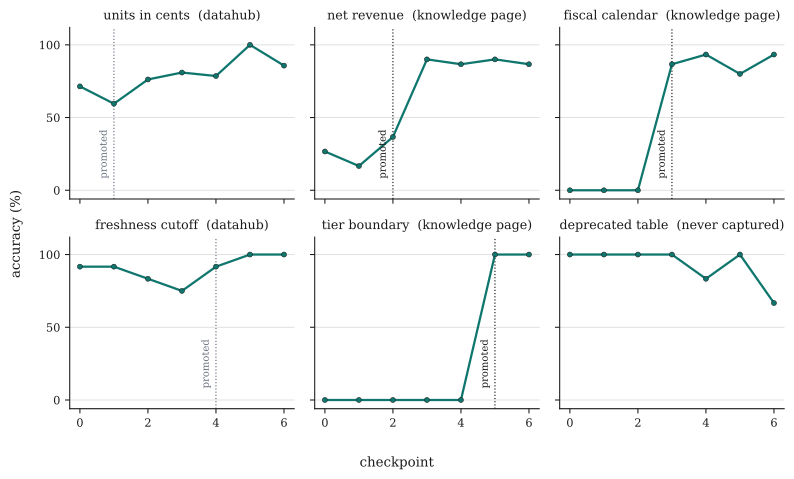
A bonus arm strengthens the story. One earlier run captured five lessons but promoted none of them to a sink, so its knowledge could reach evaluators only through the platform’s captured-memory channel. It still climbed from 52% to 96%. The memory layer is a working delivery channel in its own right, before promotion ever runs; promotion then makes the knowledge durable, shared, and visible in the catalog.
5. Results: a taught fact reaching the next person (S5)
S1 to S3 tests whether the platform delivers knowledge already present in its sinks, and the cold-start study shows the whole loop working end to end. The S5 suite instruments that loop stage by stage: whether a brand-new fact can be captured in one session and reach a later, separate session or a different person. There is no meaningful memory-off baseline here. A recall task with no memory scores 0% by construction, so S5 reports whether each stage of the lifecycle works, not an accuracy delta.
The headline is the last stage. A fact one person teaches the platform is reused correctly by a different identity 98.9% of the time (95% CI 96.8 to 100.0, 94 of 95 transfer attempts). The teammate never saw the original conversation and was never told the fact existed; it reached them through the platform or not at all.
The run behind that: 30 lifecycle protocols on claude-sonnet-5, k = 5 as five independent passes merged, leaving 149 protocol-runs after one harness exclusion, on platform build v1.118.0-4-g445e3abc. Sections 3 and 4 above are pinned to v1.102.x and are unchanged; this section is a later platform generation, so the sections are not mutually comparable and no number should be carried across that boundary.
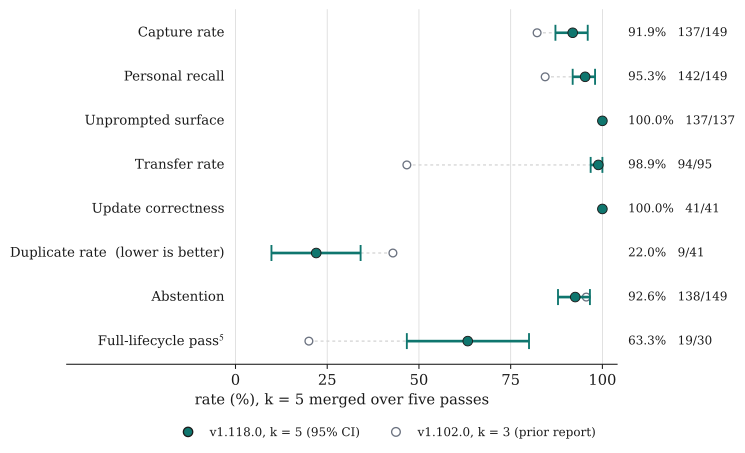
| Metric | Rate (95% CI) | num/den | Prior reportv1.102.0, k = 3 | What it measures |
|---|---|---|---|---|
| Capture rate | 91.9 [87.2–96.0] | 137/149 | 82.2 | the agent recorded the taught fact and entity-linked it |
| Personal recall | 95.3 [91.9–98.0] | 142/149 | 84.4 | a fresh same-identity session answered the fact-dependent question |
| Unprompted surface | 100.0 | 137/137 | 100.0 | among captured runs, search surfaced the saved memory unprompted |
| Transfer rate | 98.9 [96.8–100.0] | 94/95 | 46.7 | a different identity answered correctly after promotion to shared knowledge |
| Update correctness | 100.0 | 41/41 | 100.0on 7/7 | a correction flipped a later recall to the new value |
| Duplicate rate(lower is better) | 22.0 [9.8–34.1] | 9/41 | 42.9on n = 7 | a supersede that left more than one live insight |
| Abstention | 92.6 [87.9–96.6] | 138/149 | 95.6 | the agent refused to fabricate a fact it was never taught |
| Full-lifecycle pass^5 | 63.3 [46.7–80.0] | 19/30 | 20.0pass^3 | every applicable stage passed all five attempts |
The prior report’s reproducible lifecycle finding was the opposite of this one: a fact promoted to shared knowledge reached a different identity under half the time (46.7%). That gap is closed, and it closed for a nameable reason rather than a larger sample. A targeted change moved the visibility boundary to the act of applying an insight, which is the exact path the 46.7% measured. The prior report guessed the gap was a capture-and-propagation limit rather than a surfacing failure; that reading is consistent with what the fix turned out to require.
The small-denominator limitation the prior report named is also resolved. Supersede now carries 41 observations rather than 7, so duplicate rate is a point estimate at 22.0% inside a 24-point interval where it used to be a 72-point range spanning most of the scale, and update correctness holds at ceiling across a denominator six times larger.
Two rows in that table need reading carefully rather than at face value.
Capture rate at 91.9% is not a capture-reliability number. All 12 misses are attempted-and-failed, none are captures never tried, and they concentrate on 2 of the 30 protocols. The transcripts show the capture succeeding while the model links the fact to the wrong entity, so the harness’s linked-insight check does not find it where it looked. It is a filing defect, it reproduces deterministically, and it is on the register to fix.
The transfer decomposition understates delivery on purpose. The taught fact was observably surfaced to the learner in 68.4% [58.9–77.9] of transfer attempts, and used in 98.5% of those. The distance between 68.4% surfaced and 98.9% correct is measurement conservatism, not the model deriving the answer unaided: the surfacing check requires the stored fact to appear as a literal normalized substring of a tool result, so it cannot over-report delivery. All 30 correct-but-not-surfaced episodes were read back against their transcripts, and in every one the agent searched and a tool result carried the protocol’s key term. There are no cases of a correct answer without the knowledge reaching the learner.
6. Reproducibility
Every number and every figure on this page regenerates from raw run data committed to the open platform repository. A single notebook, bench/reports/knowledge-layer/report.ipynb, reads only the committed results files and recomputes every table and chart with no API key, no running platform, and no network access. The run manifests record the git commit, platform version, model, client version, seed, and task-set hash for provenance.
To rerun the experiments themselves rather than the analysis: from a booted arm, the semantic-layer run and cross-arm comparison are two commands.
git clone https://github.com/txn2/mcp-data-platform.git
cd mcp-data-platform
make bench-up BENCH_ARM=a0        # then a1, a2, a3
make bench-run BENCH_ARM=a0 LLM=anthropic MODEL=claude-sonnet-5 K=3
make bench-compare                # cross-arm tables + bootstrap CIs
The report and a snapshot of the raw run data are also archived on Zenodo under DOI 10.5281/zenodo.21438044 (CC-BY-4.0), which always resolves to the latest version. The snapshot behind the numbers on this page is v2.0.1, DOI 10.5281/zenodo.21751635, so the exact version behind them stays retrievable and citable even as the repository moves on. A frozen PDF of the report is part of that archive.
7. Limitations
- Results are model-dependent. The headline is arm-vs-arm and checkpoint-vs-checkpoint on a pinned model, never model-vs-model.
- The ablation and the cold-start study ran on two different client paths (Anthropic API and the Claude Code client) that are not accuracy-comparable; no number in either study is compared across that boundary.
- The seed dataset is small by design and airgapped; absolute accuracies are not real-world estimates. What the studies isolate, the platform effect holding everything else constant, is the point.
- The S3 trap-class figure and table are recomputed from the committed per-attempt records, so they match this data exactly; two trap classes differ slightly from an earlier tagging in the upstream summary. The headline, suite, and overall numbers are unaffected.
- In the cold-start runs the teacher never captured the deprecated-table lesson, so checkpoint 6 promotes nothing; the affected trap class was already at ceiling from the baseline, so the curve is not distorted, but it is a real capture-reliability data point.
- This report spans two platform generations and the sections are not mutually comparable. The ablation and cold-start sections are pinned to v1.102.x; the lifecycle section was re-run on v1.118.0-4-g445e3abc. Differences between the lifecycle figures here and the ones the prior report published are across-code, not the effect of a larger sample, and no number should be carried across that boundary.
- Capture rate at 91.9% carries a known filing defect rather than a capture failure: all 12 misses were attempted and recorded, but linked to the wrong entity, so the harness's linked-insight check missed them. It concentrates on 2 protocols and reproduces deterministically, which makes it a fix rather than a variance.
- Duplicate rate at 22.0% has room to improve. Roughly one supersede in five leaves more than one live insight behind, which is a real housekeeping cost even though update correctness itself is at ceiling. It is a point estimate now rather than a range, so the next run can be held to it.
8. References
- [1]Li et al. (2023). Can LLM Already Serve as a Database Interface? A Big Bench for Large-Scale Database Grounded Text-to-SQLs. NeurIPS. link
- [2]Yao et al. (2024). tau-bench: A Benchmark for Tool-Agent-User Interaction in Real-World Domains. Introduces the pass^k reliability metric. link
- [3]Wu et al. (2024). LongMemEval: Benchmarking Chat Assistants on Long-Term Interactive Memory. link
- [4]Anthropic (2024). Model Context Protocol: an open standard for connecting AI assistants to data and tools. link
The rest of the research series
Each study in the series is published brand-neutral in the open platform project, archived with its raw run data under a citable DOI, and reproducible offline from the committed attempts. New studies join the series as they are published.

The knowledge-use study · 2026-07-26
Does an agent actually use the knowledge the platform delivers?
Agents rely completely on delivered knowledge they cannot re-derive: conventions, definitions, policies. With the company definition delivered, confident fabrication fell from 75% to zero, and capable models re-verified every claim they could check.

The knowledge-pollution study · 2026-08-07
What does a wrong fact cost once it has cleared review?
A wrong fact never out-argued the correct source sitting beside it. It did something quieter: on a small model it suppressed the one query that would have refuted it, and every run that ran that query anyway answered correctly. The frontier-class models we run in production took the wrong answer zero times in 96 runs.

The graph-completion study · 2026-08-10
What do references between knowledge pages buy an agent that has to be complete?
Asked to write complete operational documents, agents followed references between knowledge pages voluntarily, grounded every governing constraint while reading 0.2% of a 5,000-page corpus, and kept discovery cost flat as the corpus grew a hundredfold; without the references, cost roughly doubled and the only failed episode appeared. With search off, references were the only route that worked: 96% of constraints recovered against zero. One pre-registered construct died by its own kill condition, and the kill is published with the result.
Everything here is inspectable
The benchmark harness, arm configurations, deterministic seed generator, graders, and the full published report all live in the open platform repository. Run the harness and every number on this page reproduces.